

28/02/2022, GPT-3
Describe and get any chart with GPT3 in Google Sheets
After releasing a spate of Google Sheet scripts which were (hopefully) of some practical use to marketers, this one is a little more for fun. It does, however, nicely show off the capabilities of OpenAI’s GPT3 machine learning technology.
You simply type a request into a cell, the script then pulls up the relevant data from GPT3 and displays it in a formatted chart.
For example, the request, “Kings of England with names starting with “e” by year of coronation.” results in the following chart:
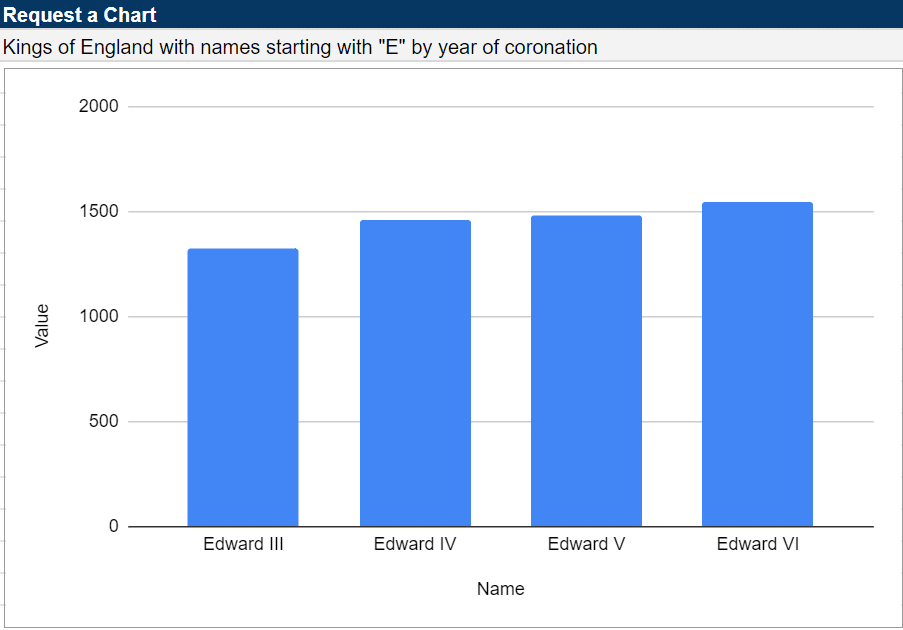
You don’t have to be especially precise with your description. Just make sure a rational human could understand it.
Where is this data coming from?
It’s important to understand that GPT-3 is not simply querying a database of known facts.
GPT-3 was trained with data from CommonCrawl, WebText, Wikipedia, and a large corpus of books. It can extract data from multiple sources instantly and combine them to assemble your request. The model was trained until the end of 2019. For example, it knows a great deal about Coronaviruses but nothing about Covid-19.
Even more impressive is the degree to which it can understand your query even when your language is imprecise. It will even make an educated guess as to the metrics you are likely to want, even when they have not been explicitly stated.
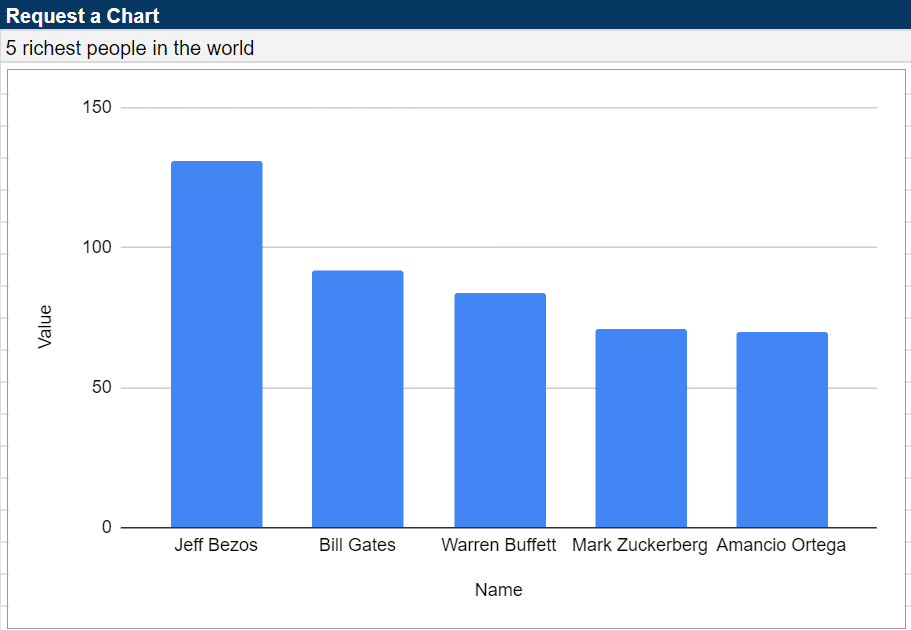
My script does not add any sorting on the data. Instead, GPT-3 sorts the results in the order it predicts will make the most sense. For example, if you request “The five smallest…”, the results are displayed with the smallest item shown first.
How can I use it?
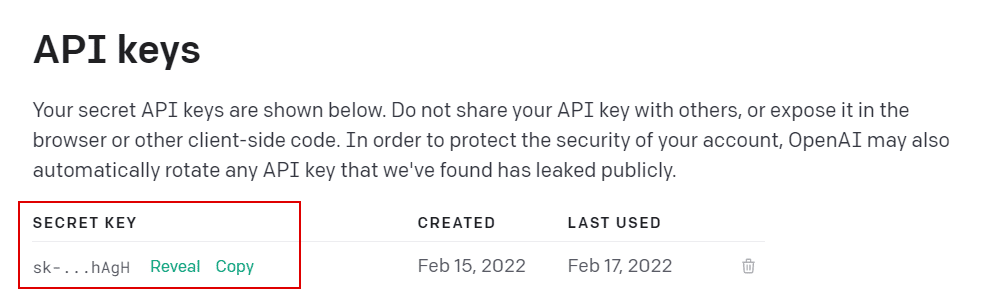
1) The first step is to register a free account at OpenAI.com
Upon registration, you will be given $18 worth of free API credits.
Once registered, grab a copy of your secret API key and save it on your device.
2) Download a copy of my free Google Sheet and script designed to make this process as easy as possible without having to understand or write any code.
3) Enter your API Key from Step 1 in cell D2 of the Google sheet.
4) Enter a description of the chart you require into cell C2. For example, “Top three best-selling albums of all time by number of copies sold.”
The words you use in this prompt will impact the quality of the output, so make sure that you explain your requirements clearly.
5) Click on “GET CHART” in the main menu.
You may be asked to grant the script permission to run if this is your first attempt.
6) After a short delay, you should see the requested data appear in columns A & B and a chart displaying the data.
Notes:
Here are a few chart you can use for testing:
- Five longest rivers in the world by length in miles.
- Six richest women in the world by wealth in billions of US dollars.
- 3 English kings with names starting with the letter “e” by year of coronation.
- 5 British football players with the most England caps by number of goals scored for England.
- Four smelliest cheeses in the world by price per kilo in euros.
- Ten best selling novels of all time by total number of copies sold.
- Three tallest mountains in the world by height in feet.
- Five longest-serving us presidents by years in office.
- 3 best-selling rock albums of all time by number of copies sold.
- Five most spoken languages in the world by number of speakers.
- 4 founders of tech companies by annual income in us dollars.
- 6 oil producing countries in the world by number of barrels produced annually.
- 3 most valuable paintings by Van Gogh by value in us dollars.
Take a look at the script behind this function by selecting Extensions > Apps Script from the main menu. Feel free to adapt it for different use cases.
I am interested to hear about any interesting charts you create with this script. Please let me know how you get on.
Check out some of my other scripts and tools for marketers using OpenAI’s technology.
